PacificGas PCG full analysis,charts,indicators,moving averages,SMA,DMA,EMA,ADX,MACD,RSIPacific Gas PCG WideScreen charts, DMA,SMA,EMA technical analysis, forecast prediction, by indicators ADX,MACD,RSI,CCI NYSE stock exchange
operates under Public Utilities sector & deals in Power Generation
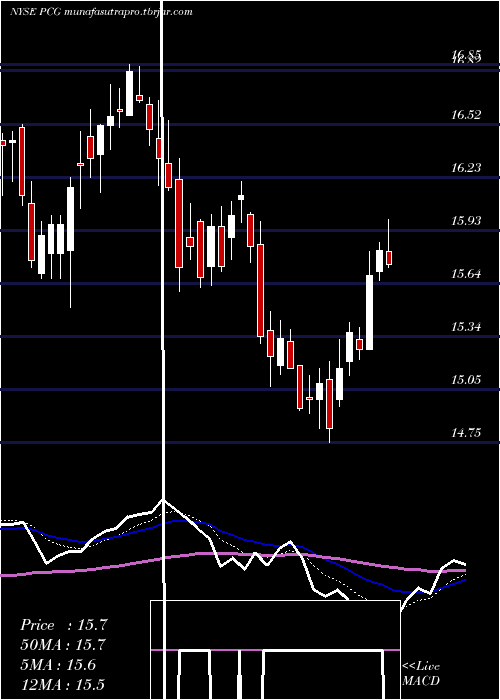
Daily price and charts and targets PacificGas Strong Daily Stock price targets for PacificGas PCG are 15.06 and 15.43 | Daily Target 1 | 14.77 | | Daily Target 2 | 14.97 | | Daily Target 3 | 15.143333333333 | | Daily Target 4 | 15.34 | | Daily Target 5 | 15.51 |
Daily price and volume Pacific Gas
| Date |
Closing |
Open |
Range |
Volume |
Fri 12 December 2025 |
15.16 (2.23%) |
14.99 |
14.95 - 15.32 |
1.0657 times |
Thu 11 December 2025 |
14.83 (-1.66%) |
15.10 |
14.75 - 15.20 |
1.1 times |
Wed 10 December 2025 |
15.08 (0.6%) |
14.99 |
14.83 - 15.16 |
1.1107 times |
Tue 09 December 2025 |
14.99 (0.33%) |
15.00 |
14.91 - 15.12 |
0.8752 times |
Mon 08 December 2025 |
14.94 (-1.45%) |
15.18 |
14.93 - 15.18 |
0.9481 times |
Fri 05 December 2025 |
15.16 (-1.11%) |
15.31 |
15.16 - 15.38 |
0.8657 times |
Thu 04 December 2025 |
15.33 (0.66%) |
15.18 |
15.13 - 15.43 |
0.7346 times |
Wed 03 December 2025 |
15.23 (-0.72%) |
15.37 |
15.06 - 15.48 |
1.4796 times |
Tue 02 December 2025 |
15.34 (-3.16%) |
15.85 |
15.30 - 15.98 |
0.9574 times |
Mon 01 December 2025 |
15.84 (-1.74%) |
16.02 |
15.75 - 16.03 |
0.8631 times |
Fri 28 November 2025 |
16.12 (0.69%) |
16.10 |
15.97 - 16.20 |
0.3079 times |
Weekly price and charts PacificGas Strong weekly Stock price targets for PacificGas PCG are 14.67 and 15.24 | Weekly Target 1 | 14.51 | | Weekly Target 2 | 14.83 | | Weekly Target 3 | 15.076666666667 | | Weekly Target 4 | 15.4 | | Weekly Target 5 | 15.65 |
Weekly price and volumes for Pacific Gas
| Date |
Closing |
Open |
Range |
Volume |
Fri 12 December 2025 |
15.16 (0%) |
15.18 |
14.75 - 15.32 |
1.1512 times |
Fri 05 December 2025 |
15.16 (-5.96%) |
16.02 |
15.06 - 16.03 |
1.1062 times |
Fri 28 November 2025 |
16.12 (2.87%) |
15.73 |
15.62 - 16.20 |
1.0709 times |
Fri 21 November 2025 |
15.67 (-4.97%) |
16.44 |
15.59 - 16.65 |
1.8584 times |
Fri 14 November 2025 |
16.49 (-0.12%) |
16.51 |
16.38 - 16.85 |
1.0378 times |
Fri 07 November 2025 |
16.51 (3.45%) |
15.82 |
15.50 - 16.60 |
0.9856 times |
Fri 31 October 2025 |
15.96 (0%) |
15.80 |
15.66 - 16.01 |
0.1659 times |
Fri 31 October 2025 |
15.96 (-2.68%) |
16.42 |
15.66 - 16.52 |
0.9497 times |
Fri 24 October 2025 |
16.40 (-0.12%) |
16.50 |
16.12 - 17.07 |
0.7906 times |
Fri 17 October 2025 |
16.42 (1.36%) |
15.92 |
15.88 - 16.91 |
0.8838 times |
Tue 07 October 2025 |
16.20 (1.76%) |
15.89 |
15.86 - 16.46 |
0.6439 times |

Monthly price and charts PacificGas Strong monthly Stock price targets for PacificGas PCG are 14.32 and 15.6 | Monthly Target 1 | 14.03 | | Monthly Target 2 | 14.6 | | Monthly Target 3 | 15.313333333333 | | Monthly Target 4 | 15.88 | | Monthly Target 5 | 16.59 |
Monthly price and volumes Pacific Gas
| Date |
Closing |
Open |
Range |
Volume |
Fri 12 December 2025 |
15.16 (-5.96%) |
16.02 |
14.75 - 16.03 |
0.5025 times |
Fri 28 November 2025 |
16.12 (1%) |
15.82 |
15.50 - 16.85 |
1.1024 times |
Fri 31 October 2025 |
15.96 (5.84%) |
15.16 |
15.13 - 17.07 |
0.9319 times |
Tue 30 September 2025 |
15.08 (-1.31%) |
15.13 |
14.34 - 16.09 |
1.2287 times |
Fri 29 August 2025 |
15.28 (8.99%) |
14.00 |
13.79 - 15.77 |
1.1906 times |
Thu 31 July 2025 |
14.02 (0.57%) |
13.91 |
12.97 - 14.27 |
1.2191 times |
Mon 30 June 2025 |
13.94 (-17.42%) |
16.75 |
13.34 - 16.80 |
1.6029 times |
Fri 30 May 2025 |
16.88 (2.18%) |
16.68 |
16.59 - 17.95 |
0.6462 times |
Wed 30 April 2025 |
16.52 (-3.84%) |
17.14 |
15.47 - 17.78 |
0.819 times |
Mon 31 March 2025 |
17.18 (5.14%) |
16.30 |
15.57 - 17.38 |
0.7566 times |
Fri 28 February 2025 |
16.34 (4.41%) |
15.44 |
14.99 - 16.47 |
1.0211 times |

DMA SMA EMA moving averages of Pacific Gas PCG
DMA (daily moving average) of Pacific Gas PCG
| DMA period | DMA value | | 5 day DMA | 15 | | 12 day DMA | 15.34 | | 20 day DMA | 15.6 | | 35 day DMA | 15.9 | | 50 day DMA | 15.99 | | 100 day DMA | 15.42 | | 150 day DMA | 15.37 | | 200 day DMA | 15.72 | EMA (exponential moving average) of Pacific Gas PCG
| EMA period | EMA current | EMA prev | EMA prev2 | | 5 day EMA | 15.07 | 15.03 | 15.13 | | 12 day EMA | 15.29 | 15.31 | 15.4 | | 20 day EMA | 15.48 | 15.51 | 15.58 | | 35 day EMA | 15.64 | 15.67 | 15.72 | | 50 day EMA | 15.78 | 15.81 | 15.85 |
SMA (simple moving average) of Pacific Gas PCG
| SMA period | SMA current | SMA prev | SMA prev2 | | 5 day SMA | 15 | 15 | 15.1 | | 12 day SMA | 15.34 | 15.38 | 15.48 | | 20 day SMA | 15.6 | 15.67 | 15.77 | | 35 day SMA | 15.9 | 15.93 | 15.98 | | 50 day SMA | 15.99 | 15.98 | 15.99 | | 100 day SMA | 15.42 | 15.4 | 15.39 | | 150 day SMA | 15.37 | 15.38 | 15.4 | | 200 day SMA | 15.72 | 15.73 | 15.73 |
|
|
