SbiEtf SETFGOLD full analysis,charts,indicators,moving averages,SMA,DMA,EMA,ADX,MACD,RSISbi Etf SETFGOLD WideScreen charts, DMA,SMA,EMA technical analysis, forecast prediction, by indicators ADX,MACD,RSI,CCI NSE stock exchange
Daily price and charts and targets SbiEtf Strong Daily Stock price targets for SbiEtf SETFGOLD are 112.65 and 114.81 | Daily Target 1 | 112.04 | | Daily Target 2 | 113.25 | | Daily Target 3 | 114.20333333333 | | Daily Target 4 | 115.41 | | Daily Target 5 | 116.36 |
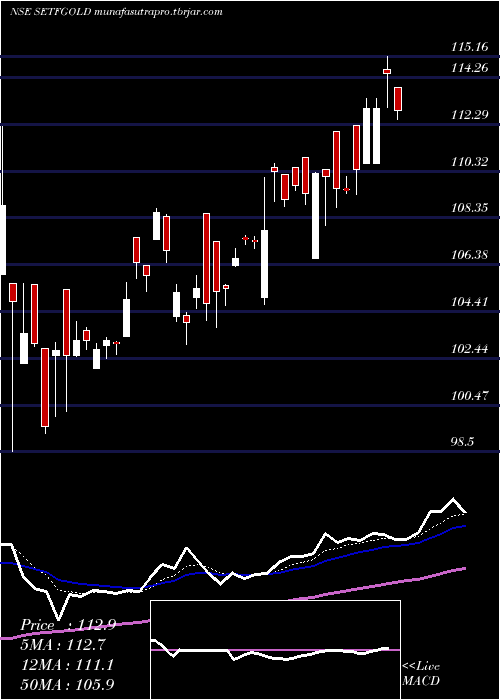
Daily price and volume Sbi Etf
| Date |
Closing |
Open |
Range |
Volume |
Mon 15 December 2025 |
114.45 (1.32%) |
114.62 |
113.00 - 115.16 |
1.1589 times |
Sat 13 December 2025 |
112.96 (0%) |
110.63 |
110.63 - 113.40 |
0.9417 times |
Fri 12 December 2025 |
112.96 (2.34%) |
110.63 |
110.63 - 113.40 |
0.9417 times |
Thu 11 December 2025 |
110.38 (0.77%) |
112.27 |
109.33 - 112.27 |
0.8954 times |
Wed 10 December 2025 |
109.54 (-0.04%) |
109.56 |
109.40 - 110.12 |
0.8263 times |
Tue 09 December 2025 |
109.58 (-0.48%) |
111.98 |
108.80 - 111.98 |
1.0228 times |
Mon 08 December 2025 |
110.11 (-0.12%) |
110.40 |
108.05 - 110.40 |
1.3523 times |
Fri 05 December 2025 |
110.24 (0.8%) |
106.63 |
106.63 - 110.29 |
0.886 times |
Thu 04 December 2025 |
109.37 (-0.31%) |
110.91 |
108.93 - 110.91 |
0.7263 times |
Wed 03 December 2025 |
109.71 (0.54%) |
110.49 |
109.51 - 110.49 |
1.2486 times |
Tue 02 December 2025 |
109.12 (-1.08%) |
110.20 |
108.86 - 110.20 |
1.2639 times |
Weekly price and charts SbiEtf Strong weekly Stock price targets for SbiEtf SETFGOLD are 112.65 and 114.81 | Weekly Target 1 | 112.04 | | Weekly Target 2 | 113.25 | | Weekly Target 3 | 114.20333333333 | | Weekly Target 4 | 115.41 | | Weekly Target 5 | 116.36 |
Weekly price and volumes for Sbi Etf
| Date |
Closing |
Open |
Range |
Volume |
Mon 15 December 2025 |
114.45 (1.32%) |
114.62 |
113.00 - 115.16 |
0.2223 times |
Sat 13 December 2025 |
112.96 (2.47%) |
110.40 |
108.05 - 113.40 |
1.1471 times |
Fri 05 December 2025 |
110.24 (2.23%) |
110.46 |
106.63 - 110.91 |
0.9804 times |
Fri 28 November 2025 |
107.83 (2.43%) |
105.50 |
104.68 - 110.06 |
0.5021 times |
Fri 21 November 2025 |
105.27 (-1.59%) |
104.20 |
103.00 - 108.55 |
0.7357 times |
Fri 14 November 2025 |
106.97 (3.78%) |
103.35 |
103.35 - 108.76 |
0.8418 times |
Fri 07 November 2025 |
103.07 (-0.14%) |
103.63 |
102.03 - 103.75 |
0.6215 times |
Fri 31 October 2025 |
103.21 (-0.29%) |
105.55 |
99.27 - 105.55 |
1.1546 times |
Fri 24 October 2025 |
103.51 (-7.17%) |
111.51 |
98.50 - 112.23 |
1.3702 times |
Fri 17 October 2025 |
111.51 (7.44%) |
106.38 |
104.10 - 112.00 |
2.4244 times |
Fri 10 October 2025 |
103.79 (3.69%) |
102.60 |
101.10 - 105.18 |
2.365 times |

Monthly price and charts SbiEtf Strong monthly Stock price targets for SbiEtf SETFGOLD are 110.54 and 119.07 | Monthly Target 1 | 103.55 | | Monthly Target 2 | 109 | | Monthly Target 3 | 112.08 | | Monthly Target 4 | 117.53 | | Monthly Target 5 | 120.61 |
Monthly price and volumes Sbi Etf
| Date |
Closing |
Open |
Range |
Volume |
Mon 15 December 2025 |
114.45 (6.14%) |
110.46 |
106.63 - 115.16 |
0.7503 times |
Fri 28 November 2025 |
107.83 (4.48%) |
103.63 |
102.03 - 110.06 |
0.8625 times |
Fri 31 October 2025 |
103.21 (4.11%) |
99.62 |
98.50 - 112.23 |
2.7031 times |
Tue 30 September 2025 |
99.14 (12.75%) |
87.93 |
87.93 - 100.97 |
1.8122 times |
Fri 29 August 2025 |
87.93 (3.81%) |
85.07 |
82.51 - 89.16 |
0.5288 times |
Thu 31 July 2025 |
84.70 (2.78%) |
83.99 |
81.20 - 86.99 |
0.5033 times |
Mon 30 June 2025 |
82.41 (0.48%) |
82.02 |
79.79 - 87.98 |
0.601 times |
Fri 30 May 2025 |
82.02 (0.63%) |
81.25 |
78.75 - 96.00 |
0.5689 times |
Wed 30 April 2025 |
81.51 (6.34%) |
77.98 |
64.96 - 97.00 |
1.0974 times |
Fri 28 March 2025 |
76.65 (4.33%) |
74.19 |
72.96 - 77.85 |
0.5726 times |
Fri 28 February 2025 |
73.47 (3.26%) |
72.46 |
70.00 - 77.25 |
0.5356 times |

DMA SMA EMA moving averages of Sbi Etf SETFGOLD
DMA (daily moving average) of Sbi Etf SETFGOLD
| DMA period | DMA value | | 5 day DMA | 112.06 | | 12 day DMA | 110.73 | | 20 day DMA | 108.94 | | 35 day DMA | 106.89 | | 50 day DMA | 106.64 | | 100 day DMA | 98.34 | | 150 day DMA | 93.31 | | 200 day DMA | 89.56 | EMA (exponential moving average) of Sbi Etf SETFGOLD
| EMA period | EMA current | EMA prev | EMA prev2 | | 5 day EMA | 112.54 | 111.58 | 110.89 | | 12 day EMA | 110.82 | 110.16 | 109.65 | | 20 day EMA | 109.54 | 109.02 | 108.61 | | 35 day EMA | 107.99 | 107.61 | 107.3 | | 50 day EMA | 106.57 | 106.25 | 105.98 |
SMA (simple moving average) of Sbi Etf SETFGOLD
| SMA period | SMA current | SMA prev | SMA prev2 | | 5 day SMA | 112.06 | 111.08 | 110.51 | | 12 day SMA | 110.73 | 110.18 | 109.71 | | 20 day SMA | 108.94 | 108.42 | 108.03 | | 35 day SMA | 106.89 | 106.57 | 106.3 | | 50 day SMA | 106.64 | 106.35 | 106.11 | | 100 day SMA | 98.34 | 98.05 | 97.77 | | 150 day SMA | 93.31 | 93.09 | 92.87 | | 200 day SMA | 89.56 | 89.36 | 89.17 |
|
|
