VanguardInternational VYMI full analysis,charts,indicators,moving averages,SMA,DMA,EMA,ADX,MACD,RSIVanguard International VYMI WideScreen charts, DMA,SMA,EMA technical analysis, forecast prediction, by indicators ADX,MACD,RSI,CCI NASDAQ stock exchange
operates under N A sector & deals in N A
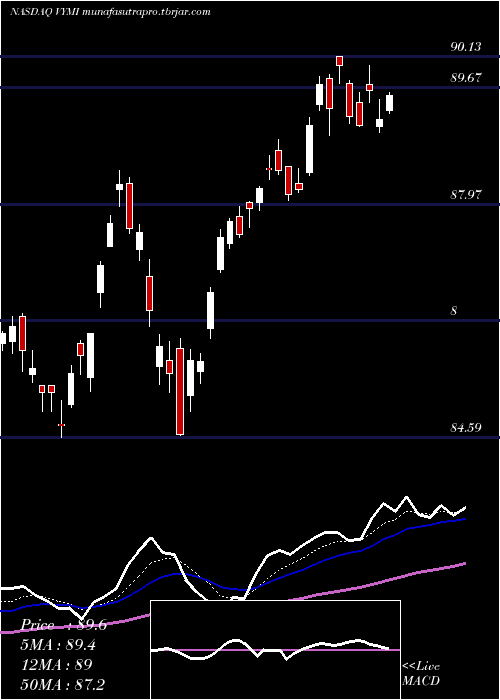
Daily price and charts and targets VanguardInternational Strong Daily Stock price targets for VanguardInternational VYMI are 88.88 and 89.52 | Daily Target 1 | 88.75 | | Daily Target 2 | 89 | | Daily Target 3 | 89.39 | | Daily Target 4 | 89.64 | | Daily Target 5 | 90.03 |
Daily price and volume Vanguard International
| Date |
Closing |
Open |
Range |
Volume |
Tue 16 December 2025 |
89.25 (-0.82%) |
89.73 |
89.14 - 89.78 |
0.967 times |
Mon 15 December 2025 |
89.99 (0.69%) |
90.13 |
89.74 - 90.13 |
0.9378 times |
Fri 12 December 2025 |
89.37 (-0.38%) |
89.81 |
88.98 - 89.87 |
0.994 times |
Thu 11 December 2025 |
89.71 (0.66%) |
89.42 |
89.34 - 89.83 |
1.245 times |
Wed 10 December 2025 |
89.12 (1.05%) |
88.44 |
88.39 - 89.23 |
1.0084 times |
Tue 09 December 2025 |
88.19 (0.08%) |
88.27 |
88.14 - 88.50 |
1.6334 times |
Mon 08 December 2025 |
88.12 (-0.38%) |
88.52 |
88.03 - 88.52 |
0.7425 times |
Fri 05 December 2025 |
88.46 (-0.02%) |
88.76 |
88.40 - 88.92 |
1.0014 times |
Thu 04 December 2025 |
88.48 (0.31%) |
88.50 |
88.34 - 88.68 |
0.7209 times |
Wed 03 December 2025 |
88.21 (0.34%) |
88.00 |
87.89 - 88.23 |
0.7496 times |
Tue 02 December 2025 |
87.91 (0.42%) |
88.00 |
87.64 - 88.02 |
0.7434 times |
Weekly price and charts VanguardInternational Strong weekly Stock price targets for VanguardInternational VYMI are 88.7 and 89.69 | Weekly Target 1 | 88.52 | | Weekly Target 2 | 88.88 | | Weekly Target 3 | 89.506666666667 | | Weekly Target 4 | 89.87 | | Weekly Target 5 | 90.5 |
Weekly price and volumes for Vanguard International
| Date |
Closing |
Open |
Range |
Volume |
Tue 16 December 2025 |
89.25 (-0.13%) |
90.13 |
89.14 - 90.13 |
0.532 times |
Fri 12 December 2025 |
89.37 (1.03%) |
88.52 |
88.03 - 89.87 |
1.5705 times |
Fri 05 December 2025 |
88.46 (0.84%) |
87.80 |
87.49 - 88.92 |
1.1574 times |
Fri 28 November 2025 |
87.72 (2.36%) |
85.55 |
85.37 - 87.77 |
0.8939 times |
Fri 21 November 2025 |
85.70 (-2.12%) |
86.93 |
84.61 - 87.17 |
1.6583 times |
Fri 14 November 2025 |
87.56 (1.7%) |
86.70 |
86.48 - 88.47 |
1.1458 times |
Fri 07 November 2025 |
86.10 (1.02%) |
84.77 |
84.59 - 86.10 |
0.8309 times |
Fri 31 October 2025 |
85.23 (0%) |
85.34 |
84.96 - 85.34 |
0.1861 times |
Fri 31 October 2025 |
85.23 (-0.42%) |
85.96 |
84.96 - 86.39 |
1.1008 times |
Fri 24 October 2025 |
85.59 (0.85%) |
85.13 |
84.70 - 85.71 |
0.9244 times |
Fri 17 October 2025 |
84.87 (2.35%) |
83.51 |
83.32 - 85.31 |
1.0049 times |

Monthly price and charts VanguardInternational Strong monthly Stock price targets for VanguardInternational VYMI are 88.37 and 91.01 | Monthly Target 1 | 86.32 | | Monthly Target 2 | 87.78 | | Monthly Target 3 | 88.956666666667 | | Monthly Target 4 | 90.42 | | Monthly Target 5 | 91.6 |
Monthly price and volumes Vanguard International
| Date |
Closing |
Open |
Range |
Volume |
Tue 16 December 2025 |
89.25 (1.74%) |
87.80 |
87.49 - 90.13 |
0.72 times |
Fri 28 November 2025 |
87.72 (2.92%) |
84.77 |
84.59 - 88.47 |
1.0003 times |
Fri 31 October 2025 |
85.23 (0.65%) |
85.04 |
82.85 - 86.39 |
1.1404 times |
Tue 30 September 2025 |
84.68 (0.7%) |
83.13 |
83.06 - 86.08 |
1.0926 times |
Fri 29 August 2025 |
84.09 (5.14%) |
80.03 |
79.55 - 85.61 |
1.0628 times |
Thu 31 July 2025 |
79.98 (-0.16%) |
80.17 |
79.57 - 82.80 |
1.1332 times |
Mon 30 June 2025 |
80.11 (1.26%) |
79.30 |
77.46 - 80.82 |
0.9907 times |
Fri 30 May 2025 |
79.11 (4.49%) |
75.67 |
75.23 - 79.51 |
1.027 times |
Wed 30 April 2025 |
75.71 (2.74%) |
73.77 |
65.08 - 76.09 |
1.0374 times |
Mon 31 March 2025 |
73.69 (1.82%) |
73.53 |
71.88 - 76.33 |
0.7957 times |
Fri 28 February 2025 |
72.37 (3.05%) |
69.09 |
68.97 - 73.51 |
0.5218 times |

DMA SMA EMA moving averages of Vanguard International VYMI
DMA (daily moving average) of Vanguard International VYMI
| DMA period | DMA value | | 5 day DMA | 89.49 | | 12 day DMA | 88.7 | | 20 day DMA | 87.68 | | 35 day DMA | 87.1 | | 50 day DMA | 86.41 | | 100 day DMA | 85.14 | | 150 day DMA | 83.35 | | 200 day DMA | 80.95 | EMA (exponential moving average) of Vanguard International VYMI
| EMA period | EMA current | EMA prev | EMA prev2 | | 5 day EMA | 89.32 | 89.36 | 89.04 | | 12 day EMA | 88.7 | 88.6 | 88.35 | | 20 day EMA | 88.13 | 88.01 | 87.8 | | 35 day EMA | 87.29 | 87.17 | 87 | | 50 day EMA | 86.59 | 86.48 | 86.34 |
SMA (simple moving average) of Vanguard International VYMI
| SMA period | SMA current | SMA prev | SMA prev2 | | 5 day SMA | 89.49 | 89.28 | 88.9 | | 12 day SMA | 88.7 | 88.57 | 88.36 | | 20 day SMA | 87.68 | 87.54 | 87.42 | | 35 day SMA | 87.1 | 87.01 | 86.89 | | 50 day SMA | 86.41 | 86.33 | 86.23 | | 100 day SMA | 85.14 | 85.07 | 84.99 | | 150 day SMA | 83.35 | 83.26 | 83.18 | | 200 day SMA | 80.95 | 80.87 | 80.78 |
|
|
