VericelCorporation VCEL full analysis,charts,indicators,moving averages,SMA,DMA,EMA,ADX,MACD,RSIVericel Corporation VCEL WideScreen charts, DMA,SMA,EMA technical analysis, forecast prediction, by indicators ADX,MACD,RSI,CCI NASDAQ stock exchange
operates under Health Care sector & deals in Biotechnology Biological Products No Diagnostic Substances
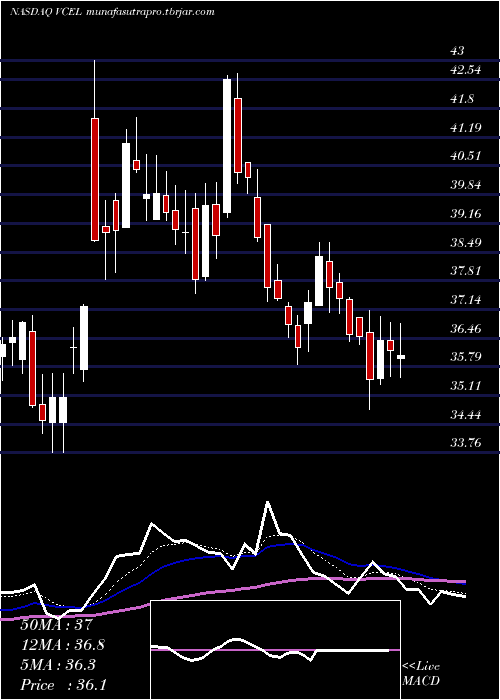
Daily price and charts and targets VericelCorporation Strong Daily Stock price targets for VericelCorporation VCEL are 36.09 and 36.72 | Daily Target 1 | 35.96 | | Daily Target 2 | 36.22 | | Daily Target 3 | 36.586666666667 | | Daily Target 4 | 36.85 | | Daily Target 5 | 37.22 |
Daily price and volume Vericel Corporation
| Date |
Closing |
Open |
Range |
Volume |
Mon 15 December 2025 |
36.49 (-0.14%) |
36.95 |
36.32 - 36.95 |
0.7467 times |
Fri 12 December 2025 |
36.54 (-2.27%) |
37.36 |
36.38 - 37.41 |
0.7096 times |
Thu 11 December 2025 |
37.39 (-0.66%) |
37.76 |
37.04 - 37.98 |
0.6831 times |
Wed 10 December 2025 |
37.64 (-1.93%) |
38.27 |
37.06 - 38.70 |
0.8786 times |
Tue 09 December 2025 |
38.38 (2.9%) |
37.22 |
37.22 - 38.70 |
1.6838 times |
Mon 08 December 2025 |
37.30 (2.95%) |
36.81 |
36.15 - 37.58 |
1.6565 times |
Fri 05 December 2025 |
36.23 (-1.52%) |
36.75 |
35.85 - 37.00 |
0.5658 times |
Thu 04 December 2025 |
36.79 (-1.6%) |
37.20 |
36.47 - 37.29 |
0.7876 times |
Wed 03 December 2025 |
37.39 (-0.69%) |
37.81 |
37.35 - 38.19 |
1.2357 times |
Tue 02 December 2025 |
37.65 (-3.01%) |
39.14 |
37.32 - 39.14 |
1.0526 times |
Mon 01 December 2025 |
38.82 (-3.55%) |
39.78 |
38.73 - 40.43 |
0.6797 times |
Weekly price and charts VericelCorporation Strong weekly Stock price targets for VericelCorporation VCEL are 36.09 and 36.72 | Weekly Target 1 | 35.96 | | Weekly Target 2 | 36.22 | | Weekly Target 3 | 36.586666666667 | | Weekly Target 4 | 36.85 | | Weekly Target 5 | 37.22 |
Weekly price and volumes for Vericel Corporation
| Date |
Closing |
Open |
Range |
Volume |
Mon 15 December 2025 |
36.49 (-0.14%) |
36.95 |
36.32 - 36.95 |
0.1872 times |
Fri 12 December 2025 |
36.54 (0.86%) |
36.81 |
36.15 - 38.70 |
1.4068 times |
Fri 05 December 2025 |
36.23 (-9.99%) |
39.78 |
35.85 - 40.43 |
1.0833 times |
Fri 28 November 2025 |
40.25 (1.69%) |
39.60 |
38.33 - 42.68 |
1.2365 times |
Fri 21 November 2025 |
39.58 (-0.7%) |
39.82 |
37.51 - 40.39 |
0.9264 times |
Fri 14 November 2025 |
39.86 (2.36%) |
39.71 |
38.01 - 41.66 |
1.0583 times |
Fri 07 November 2025 |
38.94 (11.07%) |
36.25 |
35.44 - 43.00 |
1.8667 times |
Fri 31 October 2025 |
35.06 (0%) |
34.48 |
33.76 - 35.64 |
0.2564 times |
Fri 31 October 2025 |
35.06 (-3.47%) |
36.35 |
33.76 - 36.99 |
1.0596 times |
Fri 24 October 2025 |
36.32 (2.83%) |
35.75 |
35.23 - 36.95 |
0.9188 times |
Fri 17 October 2025 |
35.32 (10.89%) |
32.21 |
31.63 - 35.76 |
1.6719 times |

Monthly price and charts VericelCorporation Strong monthly Stock price targets for VericelCorporation VCEL are 33.88 and 38.46 | Monthly Target 1 | 33.01 | | Monthly Target 2 | 34.75 | | Monthly Target 3 | 37.59 | | Monthly Target 4 | 39.33 | | Monthly Target 5 | 42.17 |
Monthly price and volumes Vericel Corporation
| Date |
Closing |
Open |
Range |
Volume |
Mon 15 December 2025 |
36.49 (-9.34%) |
39.78 |
35.85 - 40.43 |
0.561 times |
Fri 28 November 2025 |
40.25 (14.8%) |
36.25 |
35.44 - 43.00 |
1.0661 times |
Fri 31 October 2025 |
35.06 (11.41%) |
31.33 |
30.50 - 36.99 |
1.1604 times |
Tue 30 September 2025 |
31.47 (-13.45%) |
35.77 |
29.24 - 36.61 |
1.7124 times |
Fri 29 August 2025 |
36.36 (4.06%) |
34.38 |
33.09 - 38.08 |
0.9494 times |
Thu 31 July 2025 |
34.94 (-17.88%) |
41.90 |
34.87 - 43.51 |
1.1018 times |
Mon 30 June 2025 |
42.55 (3.03%) |
41.13 |
39.16 - 45.97 |
0.7642 times |
Fri 30 May 2025 |
41.30 (8.63%) |
37.98 |
37.39 - 44.41 |
1.0388 times |
Wed 30 April 2025 |
38.02 (-14.79%) |
44.34 |
37.76 - 44.97 |
0.9334 times |
Mon 31 March 2025 |
44.62 (-13%) |
51.20 |
42.53 - 52.06 |
0.7125 times |
Fri 28 February 2025 |
51.29 (-12.38%) |
58.25 |
49.22 - 63.00 |
0.6047 times |

DMA SMA EMA moving averages of Vericel Corporation VCEL
DMA (daily moving average) of Vericel Corporation VCEL
| DMA period | DMA value | | 5 day DMA | 37.29 | | 12 day DMA | 37.57 | | 20 day DMA | 38.38 | | 35 day DMA | 38.05 | | 50 day DMA | 37.01 | | 100 day DMA | 35.76 | | 150 day DMA | 37.6 | | 200 day DMA | 39.08 | EMA (exponential moving average) of Vericel Corporation VCEL
| EMA period | EMA current | EMA prev | EMA prev2 | | 5 day EMA | 36.98 | 37.23 | 37.58 | | 12 day EMA | 37.55 | 37.74 | 37.96 | | 20 day EMA | 37.75 | 37.88 | 38.02 | | 35 day EMA | 37.23 | 37.27 | 37.31 | | 50 day EMA | 36.59 | 36.59 | 36.59 |
SMA (simple moving average) of Vericel Corporation VCEL
| SMA period | SMA current | SMA prev | SMA prev2 | | 5 day SMA | 37.29 | 37.45 | 37.39 | | 12 day SMA | 37.57 | 37.9 | 38.4 | | 20 day SMA | 38.38 | 38.54 | 38.71 | | 35 day SMA | 38.05 | 38.04 | 38.03 | | 50 day SMA | 37.01 | 36.92 | 36.82 | | 100 day SMA | 35.76 | 35.79 | 35.83 | | 150 day SMA | 37.6 | 37.63 | 37.67 | | 200 day SMA | 39.08 | 39.14 | 39.22 |
|
|
