BioTechne TECH full analysis,charts,indicators,moving averages,SMA,DMA,EMA,ADX,MACD,RSIBio Techne TECH WideScreen charts, DMA,SMA,EMA technical analysis, forecast prediction, by indicators ADX,MACD,RSI,CCI NASDAQ stock exchange
operates under Health Care sector & deals in Biotechnology Biological Products No Diagnostic Substances
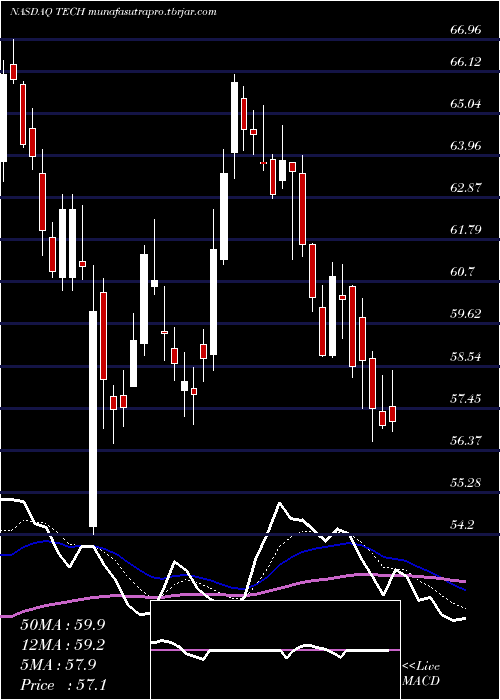
Daily price and charts and targets BioTechne Strong Daily Stock price targets for BioTechne TECH are 56.18 and 57.77 | Daily Target 1 | 55.87 | | Daily Target 2 | 56.48 | | Daily Target 3 | 57.456666666667 | | Daily Target 4 | 58.07 | | Daily Target 5 | 59.05 |
Daily price and volume Bio Techne
| Date |
Closing |
Open |
Range |
Volume |
Thu 18 December 2025 |
57.10 (0.19%) |
57.49 |
56.84 - 58.43 |
0.8777 times |
Wed 17 December 2025 |
56.99 (-0.78%) |
57.36 |
56.93 - 58.28 |
0.8605 times |
Tue 16 December 2025 |
57.44 (-2.13%) |
58.74 |
56.59 - 58.90 |
1.3943 times |
Mon 15 December 2025 |
58.69 (0.31%) |
59.78 |
57.43 - 60.28 |
0.8738 times |
Fri 12 December 2025 |
58.51 (-2.9%) |
60.57 |
58.24 - 60.60 |
1.202 times |
Thu 11 December 2025 |
60.26 (-0.94%) |
60.36 |
59.24 - 61.16 |
0.7502 times |
Wed 10 December 2025 |
60.83 (3.42%) |
58.82 |
58.75 - 61.20 |
1.1665 times |
Tue 09 December 2025 |
58.82 (-2.44%) |
60.04 |
58.78 - 60.60 |
0.9307 times |
Mon 08 December 2025 |
60.29 (-2.25%) |
61.68 |
59.95 - 61.69 |
1.0497 times |
Fri 05 December 2025 |
61.68 (-2.93%) |
63.50 |
61.35 - 63.97 |
0.8947 times |
Thu 04 December 2025 |
63.54 (-0.44%) |
63.78 |
61.27 - 63.79 |
0.7314 times |
Weekly price and charts BioTechne Strong weekly Stock price targets for BioTechne TECH are 55 and 58.69 | Weekly Target 1 | 54.3 | | Weekly Target 2 | 55.7 | | Weekly Target 3 | 57.99 | | Weekly Target 4 | 59.39 | | Weekly Target 5 | 61.68 |
Weekly price and volumes for Bio Techne
| Date |
Closing |
Open |
Range |
Volume |
Thu 18 December 2025 |
57.10 (-2.41%) |
59.78 |
56.59 - 60.28 |
0.944 times |
Fri 12 December 2025 |
58.51 (-5.14%) |
61.68 |
58.24 - 61.69 |
1.2014 times |
Fri 05 December 2025 |
61.68 (-4.39%) |
63.78 |
61.27 - 65.25 |
0.9575 times |
Fri 28 November 2025 |
64.51 (4.84%) |
61.29 |
61.16 - 66.06 |
0.8768 times |
Fri 21 November 2025 |
61.53 (3.62%) |
58.98 |
57.02 - 62.56 |
0.9785 times |
Fri 14 November 2025 |
59.38 (3.43%) |
57.77 |
56.97 - 62.31 |
1.3334 times |
Fri 07 November 2025 |
57.41 (-8.25%) |
61.22 |
54.20 - 62.67 |
1.3664 times |
Fri 31 October 2025 |
62.57 (0%) |
60.81 |
60.48 - 62.96 |
0.2518 times |
Fri 31 October 2025 |
62.57 (-5.07%) |
65.79 |
60.48 - 65.86 |
0.9794 times |
Fri 24 October 2025 |
65.91 (6.55%) |
62.50 |
62.06 - 66.96 |
1.1108 times |
Fri 17 October 2025 |
61.86 (5.46%) |
59.35 |
58.15 - 62.43 |
1.003 times |

Monthly price and charts BioTechne Strong monthly Stock price targets for BioTechne TECH are 52.52 and 61.18 | Monthly Target 1 | 50.99 | | Monthly Target 2 | 54.04 | | Monthly Target 3 | 59.646666666667 | | Monthly Target 4 | 62.7 | | Monthly Target 5 | 68.31 |
Monthly price and volumes Bio Techne
| Date |
Closing |
Open |
Range |
Volume |
Thu 18 December 2025 |
57.10 (-11.49%) |
63.78 |
56.59 - 65.25 |
0.5896 times |
Fri 28 November 2025 |
64.51 (3.1%) |
61.22 |
54.20 - 66.06 |
0.8656 times |
Fri 31 October 2025 |
62.57 (12.48%) |
55.57 |
54.40 - 66.96 |
1.1497 times |
Tue 30 September 2025 |
55.63 (1.83%) |
54.17 |
50.13 - 55.73 |
1.1735 times |
Fri 29 August 2025 |
54.63 (-0.18%) |
53.81 |
47.66 - 57.60 |
1.0461 times |
Thu 31 July 2025 |
54.73 (6.38%) |
51.12 |
49.71 - 60.06 |
1.0105 times |
Mon 30 June 2025 |
51.45 (6.3%) |
47.88 |
47.25 - 53.41 |
0.9691 times |
Fri 30 May 2025 |
48.40 (-3.87%) |
50.07 |
46.05 - 54.40 |
1.3484 times |
Wed 30 April 2025 |
50.35 (-14.12%) |
57.69 |
46.01 - 58.75 |
0.9795 times |
Mon 31 March 2025 |
58.63 (-5.05%) |
61.97 |
56.60 - 64.90 |
0.868 times |
Fri 28 February 2025 |
61.75 (-16.04%) |
72.11 |
60.94 - 79.28 |
0.7837 times |

DMA SMA EMA moving averages of Bio Techne TECH
DMA (daily moving average) of Bio Techne TECH
| DMA period | DMA value | | 5 day DMA | 57.75 | | 12 day DMA | 59.83 | | 20 day DMA | 61.17 | | 35 day DMA | 60.54 | | 50 day DMA | 61.03 | | 100 day DMA | 57.69 | | 150 day DMA | 55.55 | | 200 day DMA | 55.18 | EMA (exponential moving average) of Bio Techne TECH
| EMA period | EMA current | EMA prev | EMA prev2 | | 5 day EMA | 57.85 | 58.22 | 58.84 | | 12 day EMA | 59.24 | 59.63 | 60.11 | | 20 day EMA | 59.95 | 60.25 | 60.59 | | 35 day EMA | 60.65 | 60.86 | 61.09 | | 50 day EMA | 60.72 | 60.87 | 61.03 |
SMA (simple moving average) of Bio Techne TECH
| SMA period | SMA current | SMA prev | SMA prev2 | | 5 day SMA | 57.75 | 58.38 | 59.15 | | 12 day SMA | 59.83 | 60.32 | 60.88 | | 20 day SMA | 61.17 | 61.21 | 61.26 | | 35 day SMA | 60.54 | 60.68 | 60.88 | | 50 day SMA | 61.03 | 61.1 | 61.14 | | 100 day SMA | 57.69 | 57.69 | 57.71 | | 150 day SMA | 55.55 | 55.48 | 55.45 | | 200 day SMA | 55.18 | 55.2 | 55.22 |
|
|
