SolarCapital SLRC full analysis,charts,indicators,moving averages,SMA,DMA,EMA,ADX,MACD,RSISolar Capital SLRC WideScreen charts, DMA,SMA,EMA technical analysis, forecast prediction, by indicators ADX,MACD,RSI,CCI NASDAQ stock exchange
operates under N A sector & deals in N A
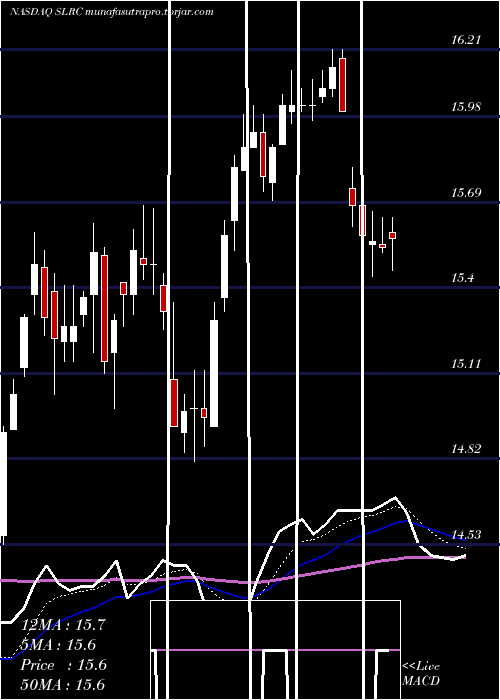
Daily price and charts and targets SolarCapital Strong Daily Stock price targets for SolarCapital SLRC are 15.34 and 15.65 | Daily Target 1 | 15.25 | | Daily Target 2 | 15.42 | | Daily Target 3 | 15.563333333333 | | Daily Target 4 | 15.73 | | Daily Target 5 | 15.87 |
Daily price and volume Solar Capital
| Date |
Closing |
Open |
Range |
Volume |
Mon 15 December 2025 |
15.58 (-0.64%) |
15.68 |
15.40 - 15.71 |
1.0383 times |
Fri 12 December 2025 |
15.68 (-2%) |
15.74 |
15.61 - 15.81 |
1.2609 times |
Thu 11 December 2025 |
16.00 (-0.93%) |
16.18 |
16.00 - 16.21 |
1.0515 times |
Wed 10 December 2025 |
16.15 (0.44%) |
16.08 |
16.05 - 16.21 |
0.9787 times |
Tue 09 December 2025 |
16.08 (0.37%) |
16.05 |
16.03 - 16.14 |
0.8925 times |
Mon 08 December 2025 |
16.02 (0%) |
16.02 |
15.97 - 16.11 |
1.2912 times |
Fri 05 December 2025 |
16.02 (0%) |
16.02 |
16.00 - 16.08 |
1.6344 times |
Thu 04 December 2025 |
16.02 (0%) |
16.00 |
15.96 - 16.14 |
0.6776 times |
Wed 03 December 2025 |
16.02 (0.88%) |
15.89 |
15.89 - 16.06 |
0.5917 times |
Tue 02 December 2025 |
15.88 (0.63%) |
15.76 |
15.70 - 15.89 |
0.5833 times |
Mon 01 December 2025 |
15.78 (-0.94%) |
15.93 |
15.73 - 15.99 |
0.716 times |
Weekly price and charts SolarCapital Strong weekly Stock price targets for SolarCapital SLRC are 15.34 and 15.65 | Weekly Target 1 | 15.25 | | Weekly Target 2 | 15.42 | | Weekly Target 3 | 15.563333333333 | | Weekly Target 4 | 15.73 | | Weekly Target 5 | 15.87 |
Weekly price and volumes for Solar Capital
| Date |
Closing |
Open |
Range |
Volume |
Mon 15 December 2025 |
15.58 (-0.64%) |
15.68 |
15.40 - 15.71 |
0.2589 times |
Fri 12 December 2025 |
15.68 (-2.12%) |
16.02 |
15.61 - 16.21 |
1.3651 times |
Fri 05 December 2025 |
16.02 (0.56%) |
15.93 |
15.70 - 16.14 |
1.0479 times |
Fri 28 November 2025 |
15.93 (4.19%) |
15.37 |
15.32 - 16.02 |
0.7669 times |
Fri 21 November 2025 |
15.29 (-0.2%) |
15.09 |
14.81 - 15.35 |
1.4473 times |
Fri 14 November 2025 |
15.32 (0.2%) |
15.42 |
15.26 - 15.68 |
1.1304 times |
Fri 07 November 2025 |
15.29 (0.13%) |
15.31 |
14.99 - 15.62 |
1.0912 times |
Fri 31 October 2025 |
15.27 (0%) |
15.22 |
15.15 - 15.41 |
0.1828 times |
Fri 31 October 2025 |
15.27 (1.53%) |
15.13 |
15.04 - 15.59 |
1.2649 times |
Fri 24 October 2025 |
15.04 (6.29%) |
14.17 |
14.08 - 15.09 |
1.4445 times |
Fri 17 October 2025 |
14.15 (0.57%) |
14.10 |
13.95 - 14.72 |
1.7267 times |

Monthly price and charts SolarCapital Strong monthly Stock price targets for SolarCapital SLRC are 15.09 and 15.9 | Monthly Target 1 | 14.92 | | Monthly Target 2 | 15.25 | | Monthly Target 3 | 15.73 | | Monthly Target 4 | 16.06 | | Monthly Target 5 | 16.54 |
Monthly price and volumes Solar Capital
| Date |
Closing |
Open |
Range |
Volume |
Mon 15 December 2025 |
15.58 (-2.2%) |
15.93 |
15.40 - 16.21 |
0.681 times |
Fri 28 November 2025 |
15.93 (4.32%) |
15.31 |
14.81 - 16.02 |
1.1306 times |
Fri 31 October 2025 |
15.27 (-0.13%) |
15.23 |
13.95 - 15.59 |
1.7628 times |
Tue 30 September 2025 |
15.29 (-8%) |
16.62 |
15.18 - 16.83 |
1.141 times |
Fri 29 August 2025 |
16.62 (3.88%) |
15.92 |
15.62 - 16.69 |
0.7735 times |
Thu 31 July 2025 |
16.00 (-0.87%) |
16.12 |
15.93 - 16.70 |
0.8109 times |
Mon 30 June 2025 |
16.14 (-3.7%) |
16.82 |
15.80 - 17.20 |
0.9081 times |
Fri 30 May 2025 |
16.76 (7.85%) |
15.57 |
15.27 - 16.83 |
0.6768 times |
Wed 30 April 2025 |
15.54 (-7.83%) |
16.84 |
13.64 - 16.99 |
1.1876 times |
Mon 31 March 2025 |
16.86 (-4.37%) |
17.62 |
16.53 - 17.94 |
0.9278 times |
Fri 28 February 2025 |
17.63 (4.26%) |
16.75 |
16.63 - 17.85 |
0.7631 times |

DMA SMA EMA moving averages of Solar Capital SLRC
DMA (daily moving average) of Solar Capital SLRC
| DMA period | DMA value | | 5 day DMA | 15.9 | | 12 day DMA | 15.93 | | 20 day DMA | 15.68 | | 35 day DMA | 15.54 | | 50 day DMA | 15.22 | | 100 day DMA | 15.69 | | 150 day DMA | 15.94 | | 200 day DMA | 15.99 | EMA (exponential moving average) of Solar Capital SLRC
| EMA period | EMA current | EMA prev | EMA prev2 | | 5 day EMA | 15.81 | 15.92 | 16.04 | | 12 day EMA | 15.83 | 15.87 | 15.91 | | 20 day EMA | 15.72 | 15.74 | 15.75 | | 35 day EMA | 15.5 | 15.5 | 15.49 | | 50 day EMA | 15.28 | 15.27 | 15.25 |
SMA (simple moving average) of Solar Capital SLRC
| SMA period | SMA current | SMA prev | SMA prev2 | | 5 day SMA | 15.9 | 15.99 | 16.05 | | 12 day SMA | 15.93 | 15.96 | 15.97 | | 20 day SMA | 15.68 | 15.67 | 15.66 | | 35 day SMA | 15.54 | 15.53 | 15.5 | | 50 day SMA | 15.22 | 15.2 | 15.19 | | 100 day SMA | 15.69 | 15.7 | 15.71 | | 150 day SMA | 15.94 | 15.94 | 15.94 | | 200 day SMA | 15.99 | 16 | 16 |
|
|
