UniversalDisplay OLED full analysis,charts,indicators,moving averages,SMA,DMA,EMA,ADX,MACD,RSIUniversal Display OLED WideScreen charts, DMA,SMA,EMA technical analysis, forecast prediction, by indicators ADX,MACD,RSI,CCI NASDAQ stock exchange
operates under Capital Goods sector & deals in Electrical Products
Daily price and charts and targets UniversalDisplay Strong Daily Stock price targets for UniversalDisplay OLED are 117.62 and 119.72 | Daily Target 1 | 117.08 | | Daily Target 2 | 118.15 | | Daily Target 3 | 119.18333333333 | | Daily Target 4 | 120.25 | | Daily Target 5 | 121.28 |
Daily price and volume Universal Display
| Date |
Closing |
Open |
Range |
Volume |
Mon 15 December 2025 |
119.21 (0.87%) |
119.49 |
118.12 - 120.22 |
1.2395 times |
Fri 12 December 2025 |
118.18 (-2.21%) |
120.68 |
117.63 - 121.01 |
0.9284 times |
Thu 11 December 2025 |
120.85 (-1.06%) |
122.04 |
119.81 - 122.31 |
0.9156 times |
Wed 10 December 2025 |
122.14 (0.54%) |
121.47 |
120.59 - 123.55 |
1.18 times |
Tue 09 December 2025 |
121.49 (-0.59%) |
122.50 |
121.17 - 124.00 |
1.0801 times |
Mon 08 December 2025 |
122.21 (0.75%) |
122.17 |
121.21 - 124.00 |
0.8623 times |
Fri 05 December 2025 |
121.30 (-0.13%) |
121.82 |
120.82 - 123.23 |
1.4293 times |
Thu 04 December 2025 |
121.46 (-0.74%) |
122.06 |
120.16 - 122.37 |
0.7255 times |
Wed 03 December 2025 |
122.37 (1.64%) |
120.99 |
120.37 - 122.61 |
0.8557 times |
Tue 02 December 2025 |
120.40 (1.82%) |
119.32 |
118.40 - 121.53 |
0.7836 times |
Mon 01 December 2025 |
118.25 (-0.57%) |
116.77 |
116.00 - 119.21 |
1.4345 times |
Weekly price and charts UniversalDisplay Strong weekly Stock price targets for UniversalDisplay OLED are 117.62 and 119.72 | Weekly Target 1 | 117.08 | | Weekly Target 2 | 118.15 | | Weekly Target 3 | 119.18333333333 | | Weekly Target 4 | 120.25 | | Weekly Target 5 | 121.28 |
Weekly price and volumes for Universal Display
| Date |
Closing |
Open |
Range |
Volume |
Mon 15 December 2025 |
119.21 (0.87%) |
119.49 |
118.12 - 120.22 |
0.2642 times |
Fri 12 December 2025 |
118.18 (-2.57%) |
122.17 |
117.63 - 124.00 |
1.0586 times |
Fri 05 December 2025 |
121.30 (1.99%) |
116.77 |
116.00 - 123.23 |
1.1145 times |
Fri 28 November 2025 |
118.93 (4.57%) |
113.79 |
113.01 - 119.68 |
0.875 times |
Fri 21 November 2025 |
113.73 (-2.65%) |
115.51 |
107.23 - 117.47 |
1.321 times |
Fri 14 November 2025 |
116.83 (-6.48%) |
125.51 |
114.78 - 125.51 |
1.6028 times |
Fri 07 November 2025 |
124.93 (-15.18%) |
141.83 |
113.80 - 147.68 |
1.9807 times |
Fri 31 October 2025 |
147.28 (0%) |
146.71 |
144.69 - 148.68 |
0.2158 times |
Fri 31 October 2025 |
147.28 (0.18%) |
148.23 |
144.69 - 152.24 |
0.7398 times |
Fri 24 October 2025 |
147.01 (-1.34%) |
150.00 |
144.07 - 153.38 |
0.8276 times |
Fri 17 October 2025 |
149.00 (8.44%) |
141.47 |
139.09 - 150.35 |
1.0655 times |

Monthly price and charts UniversalDisplay Strong monthly Stock price targets for UniversalDisplay OLED are 117.61 and 125.61 | Monthly Target 1 | 111.74 | | Monthly Target 2 | 115.47 | | Monthly Target 3 | 119.73666666667 | | Monthly Target 4 | 123.47 | | Monthly Target 5 | 127.74 |
Monthly price and volumes Universal Display
| Date |
Closing |
Open |
Range |
Volume |
Mon 15 December 2025 |
119.21 (0.24%) |
116.77 |
116.00 - 124.00 |
0.4551 times |
Fri 28 November 2025 |
118.93 (-19.25%) |
141.83 |
107.23 - 147.68 |
1.0793 times |
Fri 31 October 2025 |
147.28 (2.54%) |
142.40 |
137.32 - 153.38 |
0.806 times |
Tue 30 September 2025 |
143.63 (3.64%) |
136.41 |
133.44 - 151.00 |
1.4457 times |
Fri 29 August 2025 |
138.59 (-4.02%) |
146.10 |
135.19 - 152.39 |
0.898 times |
Thu 31 July 2025 |
144.40 (-6.51%) |
153.54 |
142.17 - 162.36 |
0.7755 times |
Mon 30 June 2025 |
154.46 (7.75%) |
143.55 |
143.01 - 163.21 |
0.8532 times |
Fri 30 May 2025 |
143.35 (14.1%) |
130.50 |
126.66 - 157.57 |
1.1648 times |
Wed 30 April 2025 |
125.63 (-9.93%) |
139.09 |
103.70 - 141.53 |
1.4045 times |
Mon 31 March 2025 |
139.48 (-9.2%) |
154.09 |
136.70 - 160.34 |
1.1178 times |
Fri 28 February 2025 |
153.62 (2.47%) |
145.18 |
140.17 - 164.29 |
1.1911 times |

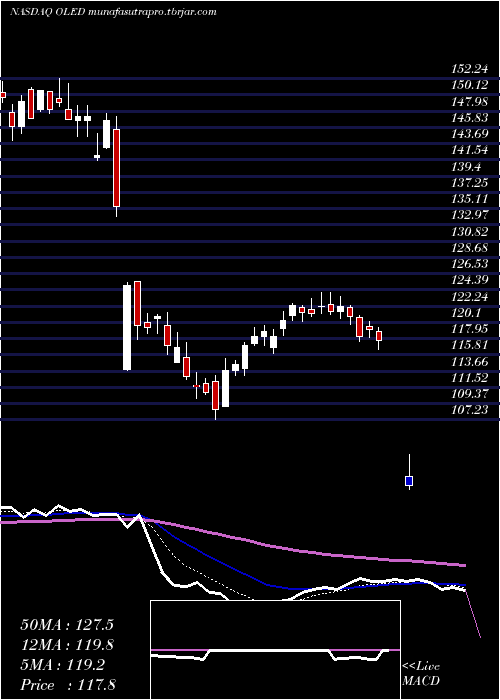
DMA SMA EMA moving averages of Universal Display OLED
DMA (daily moving average) of Universal Display OLED
| DMA period | DMA value | | 5 day DMA | 120.37 | | 12 day DMA | 120.57 | | 20 day DMA | 117.72 | | 35 day DMA | 125.34 | | 50 day DMA | 131.38 | | 100 day DMA | 136.79 | | 150 day DMA | 142.14 | | 200 day DMA | 140.17 | EMA (exponential moving average) of Universal Display OLED
| EMA period | EMA current | EMA prev | EMA prev2 | | 5 day EMA | 119.92 | 120.27 | 121.32 | | 12 day EMA | 120.12 | 120.28 | 120.66 | | 20 day EMA | 121.2 | 121.41 | 121.75 | | 35 day EMA | 125.85 | 126.24 | 126.71 | | 50 day EMA | 131.37 | 131.87 | 132.43 |
SMA (simple moving average) of Universal Display OLED
| SMA period | SMA current | SMA prev | SMA prev2 | | 5 day SMA | 120.37 | 120.97 | 121.6 | | 12 day SMA | 120.57 | 120.48 | 120.39 | | 20 day SMA | 117.72 | 117.6 | 117.54 | | 35 day SMA | 125.34 | 126.13 | 127.02 | | 50 day SMA | 131.38 | 131.87 | 132.46 | | 100 day SMA | 136.79 | 137.1 | 137.44 | | 150 day SMA | 142.14 | 142.3 | 142.46 | | 200 day SMA | 140.17 | 140.34 | 140.5 |
|
|
