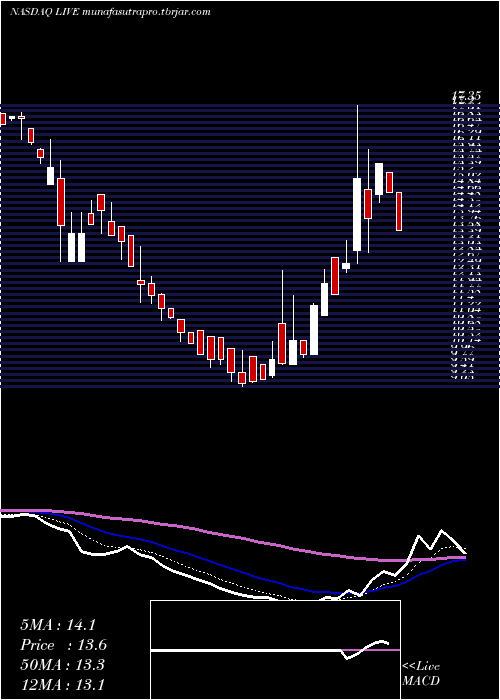
LiveVentures LIVE full analysis,charts,indicators,moving averages,SMA,DMA,EMA,ADX,MACD,RSILive Ventures LIVE WideScreen charts, DMA,SMA,EMA technical analysis, forecast prediction, by indicators ADX,MACD,RSI,CCI NASDAQ stock exchange
operates under Finance sector & deals in Finance Investors Services
Daily price and charts and targets LiveVentures Strong Daily Stock price targets for LiveVentures LIVE are 14.46 and 15.06 | Daily Target 1 | 14.36 | | Daily Target 2 | 14.56 | | Daily Target 3 | 14.96 | | Daily Target 4 | 15.16 | | Daily Target 5 | 15.56 |
Daily price and volume Live Ventures
| Date |
Closing |
Open |
Range |
Volume |
Tue 16 December 2025 |
14.76 (-5.51%) |
15.36 |
14.76 - 15.36 |
0.1769 times |
Mon 15 December 2025 |
15.62 (11.57%) |
14.70 |
14.48 - 15.62 |
0.4396 times |
Fri 12 December 2025 |
14.00 (-7.89%) |
14.87 |
13.01 - 16.04 |
2.1122 times |
Thu 11 December 2025 |
15.20 (19.78%) |
13.07 |
12.67 - 17.35 |
3.7847 times |
Wed 10 December 2025 |
12.69 (7.82%) |
12.54 |
12.41 - 13.36 |
0.8338 times |
Tue 09 December 2025 |
11.77 (-2.65%) |
12.85 |
11.77 - 12.85 |
1.0712 times |
Mon 08 December 2025 |
12.09 (5.68%) |
11.15 |
11.15 - 12.50 |
0.4194 times |
Fri 05 December 2025 |
11.44 (14.51%) |
9.99 |
9.99 - 11.50 |
0.5963 times |
Thu 04 December 2025 |
9.99 (-4.13%) |
10.40 |
9.92 - 10.40 |
0.1668 times |
Wed 03 December 2025 |
10.42 (6.98%) |
9.71 |
9.71 - 11.74 |
0.3992 times |
Tue 02 December 2025 |
9.74 (-1.12%) |
10.92 |
9.71 - 12.49 |
0.7883 times |
Weekly price and charts LiveVentures Strong weekly Stock price targets for LiveVentures LIVE are 14.62 and 15.76 | Weekly Target 1 | 13.81 | | Weekly Target 2 | 14.29 | | Weekly Target 3 | 14.953333333333 | | Weekly Target 4 | 15.43 | | Weekly Target 5 | 16.09 |
Weekly price and volumes for Live Ventures
| Date |
Closing |
Open |
Range |
Volume |
Tue 16 December 2025 |
14.76 (5.43%) |
14.70 |
14.48 - 15.62 |
0.3233 times |
Fri 12 December 2025 |
14.00 (22.38%) |
11.15 |
11.15 - 17.35 |
4.3111 times |
Fri 05 December 2025 |
11.44 (23.68%) |
9.37 |
9.32 - 12.49 |
1.1129 times |
Fri 28 November 2025 |
9.25 (-6.09%) |
10.19 |
9.05 - 10.19 |
0.8771 times |
Fri 21 November 2025 |
9.85 (-11.18%) |
11.02 |
9.61 - 11.04 |
0.6995 times |
Fri 14 November 2025 |
11.09 (-16.74%) |
13.51 |
11.00 - 13.51 |
0.6015 times |
Fri 07 November 2025 |
13.32 (-1.77%) |
14.15 |
12.79 - 14.71 |
0.5564 times |
Fri 31 October 2025 |
13.56 (0%) |
12.75 |
12.75 - 14.18 |
0.1298 times |
Fri 31 October 2025 |
13.56 (-20%) |
16.66 |
12.75 - 16.66 |
1.0228 times |
Fri 24 October 2025 |
16.95 (2.79%) |
16.97 |
16.35 - 17.55 |
0.3657 times |
Fri 17 October 2025 |
16.49 (-7.36%) |
17.13 |
16.36 - 18.78 |
1.2666 times |

Monthly price and charts LiveVentures Strong monthly Stock price targets for LiveVentures LIVE are 12.04 and 20.07 | Monthly Target 1 | 5.78 | | Monthly Target 2 | 10.27 | | Monthly Target 3 | 13.81 | | Monthly Target 4 | 18.3 | | Monthly Target 5 | 21.84 |
Monthly price and volumes Live Ventures
| Date |
Closing |
Open |
Range |
Volume |
Tue 16 December 2025 |
14.76 (59.57%) |
9.37 |
9.32 - 17.35 |
0.3055 times |
Fri 28 November 2025 |
9.25 (-31.78%) |
14.15 |
9.05 - 14.71 |
0.1454 times |
Fri 31 October 2025 |
13.56 (-26.18%) |
18.59 |
12.75 - 18.82 |
0.2653 times |
Tue 30 September 2025 |
18.37 (-7.22%) |
19.83 |
14.99 - 23.00 |
0.6036 times |
Fri 29 August 2025 |
19.80 (29.24%) |
15.56 |
13.66 - 25.42 |
1.2706 times |
Thu 31 July 2025 |
15.32 (-11.85%) |
17.98 |
13.23 - 20.55 |
0.7267 times |
Mon 30 June 2025 |
17.38 (-19.8%) |
20.80 |
7.01 - 24.35 |
5.6303 times |
Fri 30 May 2025 |
21.67 (89.92%) |
11.36 |
10.95 - 25.88 |
0.4181 times |
Wed 30 April 2025 |
11.41 (49.54%) |
7.60 |
7.45 - 16.38 |
0.5025 times |
Mon 31 March 2025 |
7.63 (-5.1%) |
7.72 |
6.50 - 7.92 |
0.1319 times |
Fri 28 February 2025 |
8.04 (-13.27%) |
9.46 |
7.32 - 9.86 |
0.1867 times |

DMA SMA EMA moving averages of Live Ventures LIVE
DMA (daily moving average) of Live Ventures LIVE
| DMA period | DMA value | | 5 day DMA | 14.45 | | 12 day DMA | 12.3 | | 20 day DMA | 11.24 | | 35 day DMA | 12.04 | | 50 day DMA | 13.59 | | 100 day DMA | 15.54 | | 150 day DMA | 16.02 | | 200 day DMA | 14.42 | EMA (exponential moving average) of Live Ventures LIVE
| EMA period | EMA current | EMA prev | EMA prev2 | | 5 day EMA | 14.28 | 14.04 | 13.25 | | 12 day EMA | 12.95 | 12.62 | 12.08 | | 20 day EMA | 12.49 | 12.25 | 11.89 | | 35 day EMA | 13.05 | 12.95 | 12.79 | | 50 day EMA | 14.06 | 14.03 | 13.97 |
SMA (simple moving average) of Live Ventures LIVE
| SMA period | SMA current | SMA prev | SMA prev2 | | 5 day SMA | 14.45 | 13.86 | 13.15 | | 12 day SMA | 12.3 | 11.84 | 11.31 | | 20 day SMA | 11.24 | 11.03 | 10.8 | | 35 day SMA | 12.04 | 12.08 | 12.12 | | 50 day SMA | 13.59 | 13.66 | 13.71 | | 100 day SMA | 15.54 | 15.55 | 15.56 | | 150 day SMA | 16.02 | 16.06 | 16.1 | | 200 day SMA | 14.42 | 14.39 | 14.35 |
|
|
