UsGlobal GOAU full analysis,charts,indicators,moving averages,SMA,DMA,EMA,ADX,MACD,RSIUs Global GOAU WideScreen charts, DMA,SMA,EMA technical analysis, forecast prediction, by indicators ADX,MACD,RSI,CCI AMEX stock exchange
Daily price and charts and targets UsGlobal Strong Daily Stock price targets for UsGlobal GOAU are 41.26 and 42.24 | Daily Target 1 | 41.06 | | Daily Target 2 | 41.45 | | Daily Target 3 | 42.04 | | Daily Target 4 | 42.43 | | Daily Target 5 | 43.02 |
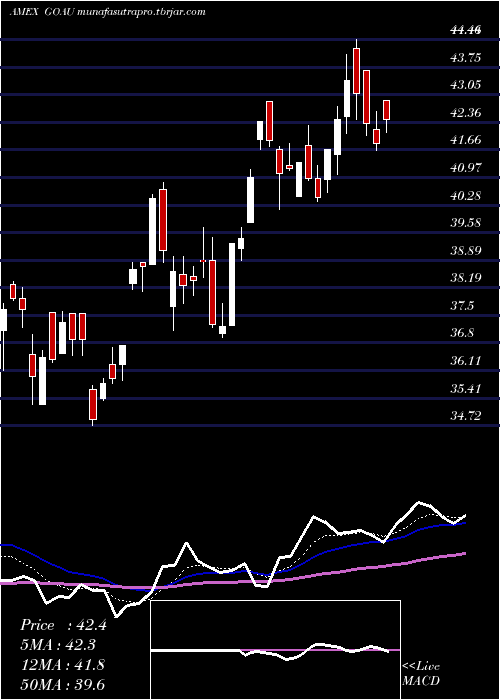
Daily price and volume Us Global
| Date |
Closing |
Open |
Range |
Volume |
Tue 16 December 2025 |
41.84 (-1.18%) |
42.17 |
41.65 - 42.63 |
1.6655 times |
Mon 15 December 2025 |
42.34 (-1.76%) |
43.67 |
42.02 - 43.67 |
1.0725 times |
Fri 12 December 2025 |
43.10 (-0.71%) |
44.21 |
42.43 - 44.46 |
0.8837 times |
Thu 11 December 2025 |
43.41 (2.29%) |
42.50 |
42.08 - 44.07 |
1.1254 times |
Wed 10 December 2025 |
42.44 (1.8%) |
41.56 |
41.04 - 42.76 |
1.2236 times |
Tue 09 December 2025 |
41.69 (3.04%) |
40.91 |
40.60 - 41.69 |
0.7052 times |
Mon 08 December 2025 |
40.46 (-1.17%) |
40.95 |
40.37 - 41.28 |
0.729 times |
Fri 05 December 2025 |
40.94 (-0.99%) |
41.78 |
40.90 - 42.28 |
0.7786 times |
Thu 04 December 2025 |
41.35 (0.39%) |
40.50 |
40.50 - 41.35 |
0.4531 times |
Wed 03 December 2025 |
41.19 (0.27%) |
41.27 |
41.15 - 41.83 |
1.3633 times |
Tue 02 December 2025 |
41.08 (-1.96%) |
41.69 |
40.17 - 41.75 |
0.576 times |
Weekly price and charts UsGlobal Strong weekly Stock price targets for UsGlobal GOAU are 40.74 and 42.76 | Weekly Target 1 | 40.37 | | Weekly Target 2 | 41.1 | | Weekly Target 3 | 42.386666666667 | | Weekly Target 4 | 43.12 | | Weekly Target 5 | 44.41 |
Weekly price and volumes for Us Global
| Date |
Closing |
Open |
Range |
Volume |
Tue 16 December 2025 |
41.84 (-2.92%) |
43.67 |
41.65 - 43.67 |
0.5047 times |
Fri 12 December 2025 |
43.10 (5.28%) |
40.95 |
40.37 - 44.46 |
0.8603 times |
Fri 05 December 2025 |
40.94 (-3.38%) |
42.88 |
40.17 - 42.88 |
0.828 times |
Fri 28 November 2025 |
42.37 (13.84%) |
37.23 |
37.23 - 42.37 |
0.4998 times |
Fri 21 November 2025 |
37.22 (-3.58%) |
38.52 |
36.95 - 39.70 |
1.0828 times |
Fri 14 November 2025 |
38.60 (5.03%) |
38.30 |
37.11 - 40.85 |
1.439 times |
Fri 07 November 2025 |
36.75 (-0.35%) |
35.64 |
34.72 - 36.75 |
1.0659 times |
Fri 31 October 2025 |
36.88 (0%) |
37.55 |
36.48 - 37.55 |
0.2611 times |
Fri 31 October 2025 |
36.88 (-2.02%) |
36.52 |
35.25 - 37.59 |
1.2638 times |
Fri 24 October 2025 |
37.64 (-6.99%) |
40.80 |
36.11 - 41.85 |
2.1945 times |
Fri 17 October 2025 |
40.47 (2.12%) |
41.06 |
39.86 - 44.40 |
1.9298 times |

Monthly price and charts UsGlobal Strong monthly Stock price targets for UsGlobal GOAU are 38.86 and 43.15 | Monthly Target 1 | 37.87 | | Monthly Target 2 | 39.85 | | Monthly Target 3 | 42.156666666667 | | Monthly Target 4 | 44.14 | | Monthly Target 5 | 46.45 |
Monthly price and volumes Us Global
| Date |
Closing |
Open |
Range |
Volume |
Tue 16 December 2025 |
41.84 (-1.25%) |
42.88 |
40.17 - 44.46 |
0.3742 times |
Fri 28 November 2025 |
42.37 (14.89%) |
35.64 |
34.72 - 42.37 |
0.6974 times |
Fri 31 October 2025 |
36.88 (-8.33%) |
40.84 |
35.25 - 44.40 |
1.682 times |
Tue 30 September 2025 |
40.23 (20.52%) |
34.07 |
33.71 - 40.60 |
2.4296 times |
Fri 29 August 2025 |
33.38 (17.45%) |
28.83 |
28.63 - 33.40 |
1.1112 times |
Thu 31 July 2025 |
28.42 (-3.14%) |
29.55 |
28.27 - 30.84 |
0.6767 times |
Mon 30 June 2025 |
29.34 (1.73%) |
29.30 |
28.23 - 31.23 |
0.558 times |
Fri 30 May 2025 |
28.84 (6.19%) |
26.41 |
25.35 - 28.84 |
0.7707 times |
Wed 30 April 2025 |
27.16 (8.21%) |
25.11 |
22.01 - 28.98 |
1.0759 times |
Mon 31 March 2025 |
25.10 (17.79%) |
21.66 |
21.10 - 25.27 |
0.6243 times |
Fri 28 February 2025 |
21.31 (0.19%) |
21.27 |
20.80 - 22.81 |
0.7561 times |

DMA SMA EMA moving averages of Us Global GOAU
DMA (daily moving average) of Us Global GOAU
| DMA period | DMA value | | 5 day DMA | 42.63 | | 12 day DMA | 41.81 | | 20 day DMA | 40.78 | | 35 day DMA | 39.33 | | 50 day DMA | 39.55 | | 100 day DMA | 37.02 | | 150 day DMA | 34.37 | | 200 day DMA | 32.09 | EMA (exponential moving average) of Us Global GOAU
| EMA period | EMA current | EMA prev | EMA prev2 | | 5 day EMA | 42.24 | 42.44 | 42.49 | | 12 day EMA | 41.71 | 41.69 | 41.57 | | 20 day EMA | 41.08 | 41 | 40.86 | | 35 day EMA | 40.52 | 40.44 | 40.33 | | 50 day EMA | 39.97 | 39.89 | 39.79 |
SMA (simple moving average) of Us Global GOAU
| SMA period | SMA current | SMA prev | SMA prev2 | | 5 day SMA | 42.63 | 42.6 | 42.22 | | 12 day SMA | 41.81 | 41.86 | 41.74 | | 20 day SMA | 40.78 | 40.6 | 40.41 | | 35 day SMA | 39.33 | 39.16 | 39.03 | | 50 day SMA | 39.55 | 39.55 | 39.52 | | 100 day SMA | 37.02 | 36.9 | 36.78 | | 150 day SMA | 34.37 | 34.26 | 34.17 | | 200 day SMA | 32.09 | 31.99 | 31.88 |
|
|
