PacerGlobal GCOW full analysis,charts,indicators,moving averages,SMA,DMA,EMA,ADX,MACD,RSIPacer Global GCOW WideScreen charts, DMA,SMA,EMA technical analysis, forecast prediction, by indicators ADX,MACD,RSI,CCI AMEX stock exchange
Daily price and charts and targets PacerGlobal Strong Daily Stock price targets for PacerGlobal GCOW are 41.58 and 41.84 | Daily Target 1 | 41.53 | | Daily Target 2 | 41.63 | | Daily Target 3 | 41.786666666667 | | Daily Target 4 | 41.89 | | Daily Target 5 | 42.05 |
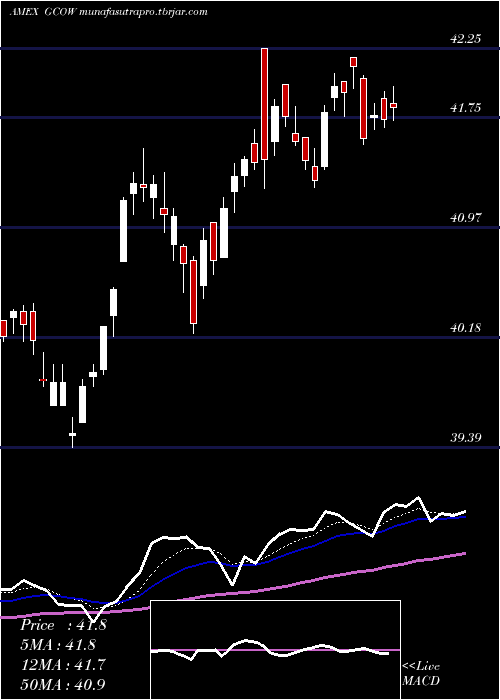
Daily price and volume Pacer Global
| Date |
Closing |
Open |
Range |
Volume |
Thu 18 December 2025 |
41.74 (-0.07%) |
41.89 |
41.68 - 41.94 |
0.8698 times |
Wed 17 December 2025 |
41.77 (0.41%) |
41.75 |
41.67 - 41.85 |
1.5642 times |
Tue 16 December 2025 |
41.60 (-1.23%) |
42.03 |
41.56 - 42.05 |
1.3427 times |
Mon 15 December 2025 |
42.12 (0.45%) |
42.18 |
41.96 - 42.18 |
0.9381 times |
Fri 12 December 2025 |
41.93 (-0.1%) |
42.01 |
41.76 - 42.01 |
0.6502 times |
Thu 11 December 2025 |
41.97 (0.43%) |
41.90 |
41.80 - 42.07 |
0.8827 times |
Wed 10 December 2025 |
41.79 (1.19%) |
41.40 |
41.38 - 41.84 |
1.175 times |
Tue 09 December 2025 |
41.30 (-0.34%) |
41.40 |
41.25 - 41.53 |
0.6924 times |
Mon 08 December 2025 |
41.44 (-0.34%) |
41.61 |
41.38 - 41.61 |
0.8875 times |
Fri 05 December 2025 |
41.58 (-0.43%) |
41.64 |
41.55 - 41.83 |
0.9973 times |
Thu 04 December 2025 |
41.76 (-0.17%) |
41.99 |
41.69 - 41.99 |
1.601 times |
Weekly price and charts PacerGlobal Strong weekly Stock price targets for PacerGlobal GCOW are 41.34 and 41.96 | Weekly Target 1 | 41.21 | | Weekly Target 2 | 41.47 | | Weekly Target 3 | 41.826666666667 | | Weekly Target 4 | 42.09 | | Weekly Target 5 | 42.45 |
Weekly price and volumes for Pacer Global
| Date |
Closing |
Open |
Range |
Volume |
Thu 18 December 2025 |
41.74 (-0.45%) |
42.18 |
41.56 - 42.18 |
0.9066 times |
Fri 12 December 2025 |
41.93 (0.84%) |
41.61 |
41.25 - 42.07 |
0.8245 times |
Fri 05 December 2025 |
41.58 (0.31%) |
41.57 |
41.24 - 42.25 |
1.5593 times |
Fri 28 November 2025 |
41.45 (1.42%) |
41.00 |
40.63 - 41.47 |
0.9555 times |
Fri 21 November 2025 |
40.87 (-0.97%) |
41.10 |
40.21 - 41.36 |
1.0861 times |
Fri 14 November 2025 |
41.27 (2.51%) |
40.34 |
40.19 - 41.53 |
1.1356 times |
Fri 07 November 2025 |
40.26 (1%) |
39.48 |
39.39 - 40.26 |
1.1727 times |
Fri 31 October 2025 |
39.86 (0%) |
39.69 |
39.69 - 39.99 |
0.1545 times |
Fri 31 October 2025 |
39.86 (-0.82%) |
40.32 |
39.69 - 40.42 |
0.9737 times |
Fri 24 October 2025 |
40.19 (0.35%) |
40.07 |
39.89 - 40.31 |
1.2316 times |
Fri 17 October 2025 |
40.05 (2.46%) |
39.22 |
39.08 - 40.08 |
0.8536 times |

Monthly price and charts PacerGlobal Strong monthly Stock price targets for PacerGlobal GCOW are 41.49 and 42.5 | Monthly Target 1 | 40.73 | | Monthly Target 2 | 41.24 | | Monthly Target 3 | 41.743333333333 | | Monthly Target 4 | 42.25 | | Monthly Target 5 | 42.75 |
Monthly price and volumes Pacer Global
| Date |
Closing |
Open |
Range |
Volume |
Thu 18 December 2025 |
41.74 (0.7%) |
41.57 |
41.24 - 42.25 |
0.5251 times |
Fri 28 November 2025 |
41.45 (3.99%) |
39.48 |
39.39 - 41.53 |
0.6942 times |
Fri 31 October 2025 |
39.86 (0.61%) |
39.86 |
39.02 - 40.42 |
0.7294 times |
Tue 30 September 2025 |
39.62 (-1.32%) |
39.86 |
39.12 - 40.10 |
0.7376 times |
Fri 29 August 2025 |
40.15 (5.38%) |
38.33 |
37.96 - 40.76 |
0.7922 times |
Thu 31 July 2025 |
38.10 (0.34%) |
38.06 |
37.94 - 39.70 |
0.9366 times |
Mon 30 June 2025 |
37.97 (0.85%) |
37.81 |
37.36 - 38.57 |
1.0866 times |
Fri 30 May 2025 |
37.65 (2.39%) |
36.82 |
36.50 - 37.89 |
0.9233 times |
Wed 30 April 2025 |
36.77 (-0.57%) |
37.18 |
32.52 - 37.18 |
1.8426 times |
Mon 31 March 2025 |
36.98 (2.3%) |
36.56 |
36.00 - 37.71 |
1.7324 times |
Fri 28 February 2025 |
36.15 (4.18%) |
34.22 |
33.82 - 36.65 |
1.1359 times |

DMA SMA EMA moving averages of Pacer Global GCOW
DMA (daily moving average) of Pacer Global GCOW
| DMA period | DMA value | | 5 day DMA | 41.83 | | 12 day DMA | 41.74 | | 20 day DMA | 41.47 | | 35 day DMA | 41.05 | | 50 day DMA | 40.7 | | 100 day DMA | 40.16 | | 150 day DMA | 39.49 | | 200 day DMA | 38.69 | EMA (exponential moving average) of Pacer Global GCOW
| EMA period | EMA current | EMA prev | EMA prev2 | | 5 day EMA | 41.77 | 41.78 | 41.79 | | 12 day EMA | 41.67 | 41.66 | 41.64 | | 20 day EMA | 41.49 | 41.46 | 41.43 | | 35 day EMA | 41.13 | 41.09 | 41.05 | | 50 day EMA | 40.75 | 40.71 | 40.67 |
SMA (simple moving average) of Pacer Global GCOW
| SMA period | SMA current | SMA prev | SMA prev2 | | 5 day SMA | 41.83 | 41.88 | 41.88 | | 12 day SMA | 41.74 | 41.71 | 41.68 | | 20 day SMA | 41.47 | 41.42 | 41.39 | | 35 day SMA | 41.05 | 41.01 | 40.97 | | 50 day SMA | 40.7 | 40.66 | 40.63 | | 100 day SMA | 40.16 | 40.13 | 40.11 | | 150 day SMA | 39.49 | 39.45 | 39.42 | | 200 day SMA | 38.69 | 38.67 | 38.64 |
|
|
