JapanSmallcap DFJ full analysis,charts,indicators,moving averages,SMA,DMA,EMA,ADX,MACD,RSIJapan Smallcap DFJ WideScreen charts, DMA,SMA,EMA technical analysis, forecast prediction, by indicators ADX,MACD,RSI,CCI AMEX stock exchange
Daily price and charts and targets JapanSmallcap Strong Daily Stock price targets for JapanSmallcap DFJ are 95.76 and 96.22 | Daily Target 1 | 95.68 | | Daily Target 2 | 95.84 | | Daily Target 3 | 96.143333333333 | | Daily Target 4 | 96.3 | | Daily Target 5 | 96.6 |
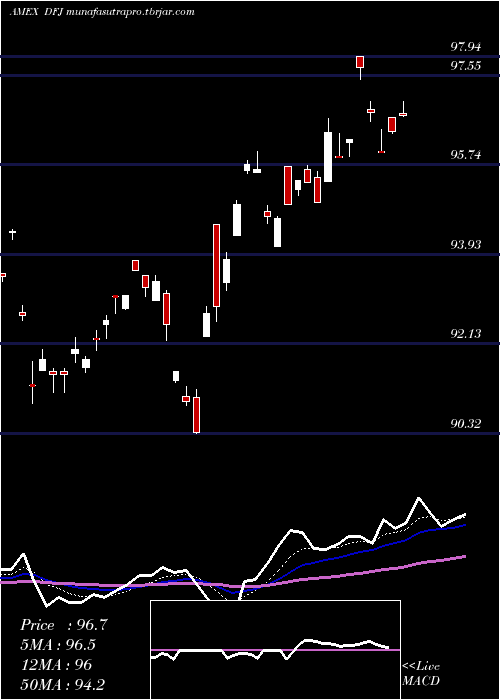
Daily price and volume Japan Smallcap
| Date |
Closing |
Open |
Range |
Volume |
Wed 17 December 2025 |
95.99 (-0.83%) |
96.00 |
95.99 - 96.45 |
0.4528 times |
Tue 16 December 2025 |
96.79 (-0.94%) |
96.86 |
96.62 - 97.02 |
0.9717 times |
Mon 15 December 2025 |
97.71 (1.52%) |
97.94 |
97.46 - 97.94 |
0.7052 times |
Fri 12 December 2025 |
96.25 (0.39%) |
96.19 |
95.90 - 96.25 |
0.3956 times |
Thu 11 December 2025 |
95.88 (-0.54%) |
95.90 |
95.88 - 96.37 |
0.9803 times |
Wed 10 December 2025 |
96.40 (1.48%) |
95.40 |
95.40 - 96.68 |
4.5147 times |
Tue 09 December 2025 |
94.99 (-0.42%) |
95.48 |
94.99 - 95.61 |
0.3858 times |
Mon 08 December 2025 |
95.39 (-0.03%) |
95.66 |
95.39 - 95.72 |
0.3666 times |
Fri 05 December 2025 |
95.42 (0.52%) |
95.25 |
95.13 - 95.42 |
0.1566 times |
Thu 04 December 2025 |
94.93 (0.29%) |
95.70 |
94.93 - 95.70 |
1.0708 times |
Wed 03 December 2025 |
94.66 (-0.05%) |
94.09 |
94.09 - 94.69 |
0.4644 times |
Weekly price and charts JapanSmallcap Strong weekly Stock price targets for JapanSmallcap DFJ are 95.02 and 96.97 | Weekly Target 1 | 94.69 | | Weekly Target 2 | 95.34 | | Weekly Target 3 | 96.64 | | Weekly Target 4 | 97.29 | | Weekly Target 5 | 98.59 |
Weekly price and volumes for Japan Smallcap
| Date |
Closing |
Open |
Range |
Volume |
Wed 17 December 2025 |
95.99 (-0.27%) |
97.94 |
95.99 - 97.94 |
0.8316 times |
Fri 12 December 2025 |
96.25 (0.87%) |
95.66 |
94.99 - 96.68 |
2.5939 times |
Fri 05 December 2025 |
95.42 (-0.33%) |
95.59 |
94.09 - 96.00 |
1.3021 times |
Fri 28 November 2025 |
95.74 (3.25%) |
94.53 |
92.57 - 95.83 |
0.6783 times |
Fri 21 November 2025 |
92.73 (-0.71%) |
93.14 |
90.32 - 93.19 |
0.7845 times |
Fri 14 November 2025 |
93.39 (0.86%) |
93.09 |
92.73 - 93.81 |
0.894 times |
Fri 07 November 2025 |
92.59 (1.18%) |
91.92 |
91.54 - 92.69 |
0.7708 times |
Fri 31 October 2025 |
91.51 (0%) |
91.57 |
91.14 - 91.62 |
0.3895 times |
Fri 31 October 2025 |
91.51 (-2.1%) |
94.38 |
90.91 - 94.44 |
1.021 times |
Fri 24 October 2025 |
93.47 (0.66%) |
93.53 |
92.34 - 93.87 |
0.7344 times |
Fri 17 October 2025 |
92.86 (3.13%) |
90.21 |
89.97 - 92.89 |
0.7896 times |

Monthly price and charts JapanSmallcap Strong monthly Stock price targets for JapanSmallcap DFJ are 95.04 and 98.89 | Monthly Target 1 | 92.16 | | Monthly Target 2 | 94.07 | | Monthly Target 3 | 96.006666666667 | | Monthly Target 4 | 97.92 | | Monthly Target 5 | 99.86 |
Monthly price and volumes Japan Smallcap
| Date |
Closing |
Open |
Range |
Volume |
Wed 17 December 2025 |
95.99 (0.26%) |
95.59 |
94.09 - 97.94 |
0.4099 times |
Fri 28 November 2025 |
95.74 (4.62%) |
91.92 |
90.32 - 95.83 |
0.2712 times |
Fri 31 October 2025 |
91.51 (-3.5%) |
94.13 |
89.61 - 94.91 |
0.4495 times |
Tue 30 September 2025 |
94.83 (1.65%) |
92.62 |
92.62 - 96.81 |
0.7195 times |
Fri 29 August 2025 |
93.29 (7.24%) |
88.30 |
87.93 - 94.22 |
0.7343 times |
Thu 31 July 2025 |
86.99 (1.52%) |
85.91 |
83.54 - 88.24 |
0.7319 times |
Mon 30 June 2025 |
85.69 (1.26%) |
85.62 |
83.39 - 86.10 |
1.2791 times |
Fri 30 May 2025 |
84.62 (2.37%) |
81.42 |
81.05 - 84.83 |
0.9341 times |
Wed 30 April 2025 |
82.66 (4.28%) |
78.63 |
70.04 - 83.13 |
2.2065 times |
Mon 31 March 2025 |
79.27 (2.99%) |
78.02 |
77.44 - 81.18 |
2.2639 times |
Fri 28 February 2025 |
76.97 (1.37%) |
75.25 |
74.95 - 77.94 |
0.9312 times |

DMA SMA EMA moving averages of Japan Smallcap DFJ
DMA (daily moving average) of Japan Smallcap DFJ
| DMA period | DMA value | | 5 day DMA | 96.52 | | 12 day DMA | 95.76 | | 20 day DMA | 94.81 | | 35 day DMA | 93.75 | | 50 day DMA | 93.36 | | 100 day DMA | 93.38 | | 150 day DMA | 90.56 | | 200 day DMA | 87.84 | EMA (exponential moving average) of Japan Smallcap DFJ
| EMA period | EMA current | EMA prev | EMA prev2 | | 5 day EMA | 96.38 | 96.57 | 96.46 | | 12 day EMA | 95.8 | 95.77 | 95.58 | | 20 day EMA | 95.17 | 95.08 | 94.9 | | 35 day EMA | 94.43 | 94.34 | 94.2 | | 50 day EMA | 93.71 | 93.62 | 93.49 |
SMA (simple moving average) of Japan Smallcap DFJ
| SMA period | SMA current | SMA prev | SMA prev2 | | 5 day SMA | 96.52 | 96.61 | 96.25 | | 12 day SMA | 95.76 | 95.73 | 95.64 | | 20 day SMA | 94.81 | 94.59 | 94.37 | | 35 day SMA | 93.75 | 93.66 | 93.59 | | 50 day SMA | 93.36 | 93.31 | 93.26 | | 100 day SMA | 93.38 | 93.28 | 93.19 | | 150 day SMA | 90.56 | 90.46 | 90.37 | | 200 day SMA | 87.84 | 87.75 | 87.65 |
|
|
